


GIMA student Tim Tensen did his internship for GIMA at Nederland van Boven (The Netherlands from Above). His work there helped create the GIS-input used in this video. Have a look and see what GIMA can help you create!
Video on Honey Buzzards
Video on Organs
Tim Tensen’s story:
“In the beginning of January my seat behind the computer in the university library was switched with an internship desk chair at the Netherlands from Above newsroom. During my short break before the six months in the hectic world of the media would start, the first datasets began to appear in my inbox. The tone was set.
During my internship I worked together with a team of five people: producer, chief-editor, two editors and data-journalist. Frederik, the data-journalist, and I were responsible for the data-animations for the second season. When my internship started the themes of the ten episodes and the ideas for the data-animations were already roughly sketched and the first contacts had been made with potential data suppliers. By the end of October, we were still busy giving the animations their final touch. The process that we went through in between roughly comes down to the following.
The first step is the search for data. Sending emails, calling, calling again and making visits eventually will pay off. This process can take from one week up to five months. The next step is cleaning and exploring the data. Once the data is clean, visualizing the data is the most exciting moment: does the data actually contain this beautiful pattern? Do strange things happen that catch the eye? Especially when combining different datasets the suspense of finding interesting relationships is palpable. But, a beautiful pattern or relationship isn’t a story yet. A story is all about connecting events and creating a plot in such a way it will inspire emotions in the audience. Close collaboration with the chief-editor and editors is crucial in this stage. After writing the storyboard, mailing back and forth with the animation team in the United Kingdom and continually postponing deadlines, the one minute of blood sweat and tears is finally broadcast on television.
Every animation has its own anecdote. When making the animation about the import and export of agricultural goods, the data told us the surprising story that the Islamic country of Iran imports a lot of beer from the Netherlands. The import-export dataset, however, appeared to be wrongly processed by the supplier. Further, we almost told the story that the Dutch only eat oliebollen at New Year’s Eve and go to bed early as food orders for that night were not present in the data. It appeared however, that the take away delivery company was simply closed that night.
Sometimes, the data is like a present when it contains a story that is so perfect that any further exploration and analysis is unnecessary. Still my eyes fill with tears when I hear the Shakespearean tragedy of the two Honey buzzard birds.
A lot of ideas stayed ideas. Telling companies that their data is food for great stories was often not enough to overcome their fears. A beautiful dataset that contained all the PIN transactions during the day was taken back after the company got bad press for selling their data to other parties. Also, giving us the OV chip behaviour data of students was thought to be too politically sensitive. Sometimes, a lot of patience is needed to get the things you want. The organization that held the data of the locations of airplanes that crashed in the IJsselmeer during WOll repeatedly spoke their worry about privacy regarding the data. So, we decided to try to get it another way. A major from the Dutch army finally gave us the information (and even forgot his laptop in our newsroom). Altogether, we managed to receive more than 40 different datasets. Luckily a lot of companies, governments, research institutes, universities, GPS bearers, did see the beauty of their data!
For many of the animations we used GPS tracking. One of the things we tracked was living organs from a donor body. After the donor dies, specialists and ambulance drivers are called. In a very tight schedule the organs are transported to hospitals all over the country. Getting all the GPS in the right ambulance in the right time seemed almost impossible; it was the smoothest data to collect. Also, tracking the transport of roses from the greenhouse to the airport in Kenia succeeded in one try. Tracking the transport of flowers from Rijnsburg to Aalsmeer however, turned out to be too complex for the transportation company. Losing the track of the dog that was herding sheep over the Brienenoordbrug was just bad luck. The GPS ended up in the water after the herder awarded the dog a swim to cool down. In addition, four GPS trackers that we had tied on the sheep were lost during the journey.
And there is a lot more to tell. In general I can say that the variety of datasets that I have had in my hands, the visits to different companies and working in an environment among journalists has really inspired me. This internship made me aware of the great value geo-data. It is a great source for finding stories about the patterns of our society. Stories that the public is waiting for to hear and that will make them more aware of the unseen things that happen around them! I am glad that I have contributed to the bringing to life of geo-data. At this moment I am writing my thesis about the animations to tell the more theoretical story of how to tell stories with geo-data. After I am graduated, I can`t wait to continue making inspiring geo-data stories!”
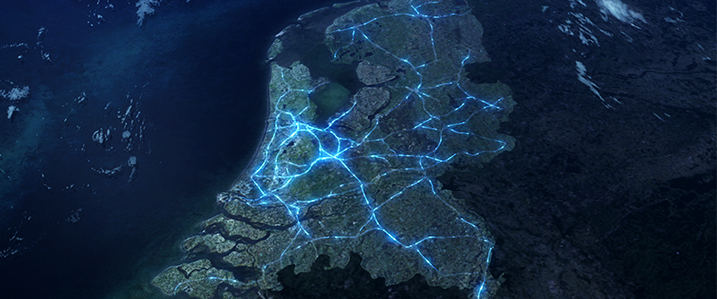
Nederland van Boven picture from the series